- Performance Task
- Created by Defined Learning
- 30 Student Check-ins
- 6 Products
Introduction
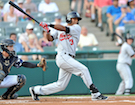
During the past year, a number of baseball bat companies have approached the University of Eastern Pennsylvania with suggestions as to the type of bat that should be used by their baseball team. The team may only purchase new bats once every three years due to budget constraints. It is critical that they choose the best, most technically advanced bats so as not to be at a disadvantage with other teams. A conflict of interest has arisen, since most of the companies are offering suggestions that include buying their bats. You have been hired to help the baseball team make the best possible choice. Your choice will affect the team for the next three years. The data gathering and analysis process will be vital to your decision. The audience will need to be able to view the data in a manner that is user-friendly and easy to understand.
Driving Question

- What do people at test laboratories do in their jobs?
- Why do products need to be tested?
- What is a baseball bat’s “sweet spot” and why is this important to understand?
Big Idea
- Technological literacy is the ability to use, assess and manage technology around us.
- An object's motion is the result of all forces acting on it.
- Some questions can be answered by collecting, representing, and analyzing data.
Essential Questions
- How would you apply technological design and problem solving methods to the development of inventions and innovations?
- What causes objects to move?
- How can we use numerical relationships to solve problems?
G.R.A.S.P.
The University of Eastern Pennsylvania has hired your engineering consulting company to assist the head baseball coach in choosing the bats that will be used by the baseball team this spring.
Role
You are a consultant specializing in engineering and data analysis. You have been hired by the University of Eastern Pennsylvania to conduct research and experiments on baseball bats. The embedded simulation will allow you to conduct research and gather data critical to your decision- making process.
Audience
Your audience will be the coaching staff, manager, and baseball team captains who will be making the final decision. Your conclusions will be essential to their decision- making process, and to their selection of the most beneficial bat to help the college baseball players to succeed in the batter's box.
Situation
During the past year, a number of baseball bat companies have approached the University of Eastern Pennsylvania with suggestions as to the type of bat that should be selected and used by the baseball team. The team may only purchase new bats once every three years, due to budget constraints. It is critical that they choose the best, most technically advanced bats, so as not to be at a disadvantage with other teams. A conflict of interest has arisen since most of the companies are offering suggestions that include buying their bats. You have been hired to help the baseball team make the best possible choice. Your choice will affect the team for the next three years. The data-gathering and analysis process will be vital to your decision. The audience will need to be able to view the data in a manner that is user friendly and easy to understand.
The simulation located in Step 3: Do the Research may be helpful in the data gathering process.
*Please note, the simulation referenced here is not compatible with tablets or other mobile devices.
Marketing Design
Your consulting firm has a contract to design a logo to be placed on the bats that the university selected. The design/logo should have strong connection to the team for which it is developed. Eastern Pennsylvania's mascot is the Golden Eagle, however with your teacher's permission you may ask to design a logo for a university of your choice. Keep in mind that you must also explain the reasons for your design and how it ties into the university/community for whom it was developed.
Drawing and Abstract
Your task is to either draw or develop a computer replica of your chosen bat. This drawing/draft should be done to scale and should include length and weight information. Be sure to create a key that includes your scale measurement. With this drawing now create a visualization that demonstrates the motions of the two colliding objects (baseball and bat). With your drawing complete, provide an abstract explaining how Newton's Third Law applies to this situation. Also, briefly explain how the different materials used to make the baseball bats affect the collision with the baseball.
Data Table
Your task is to create a data table that compares wood, metal, and composite bats. You will not have time to test all of the different combinations of length, weight, and sweet-spot location, so your first step will be to figure out which values you will want to plug into the simulation in order to come up with meaningful data for selecting a bat.
Step two in this task is to test the bats and record your data.
Next you will use your data to create a data table, graph, chart, or other visual representation of your results.
Finally, provide a recommendation for the type of bat that the team should purchase based on an analysis of your data.
Be prepared to explain to your teacher why you chose the lengths, weights, and sweet-spot locations that you did. The data table should also include information about how many trials of each variable you did and why you think this number gives you reliable data.
Research Paper/Report
Create a report to be submitted to the University of Eastern Pennsylvania that describes the research process that you used to test the different baseball bats. Include information about the types of bat and the characteristics of each material. This report should state the reasons you had for using some lengths, weights, and sweet-spot locations but not others (i.e. you did not test between 24 and 28 inches because nobody on a college team uses a bat that short). It should also include information about how many trials of each variable you did and why you think this number gives you reliable data.
Multimedia Presentation
This will form the basis of your presentation to the coach and captains of the team. This presentation should support your discussion and may have the other products embedded within. Be sure this presentation references the research you conducted related to the types of materials used to make bats. This should also include the durability and cost of each type of bat. Share with the audience the test you performed and the variables that were considered (simulation). How did the data gathered inform your decision? At the end of your presentation, provide your conclusions based upon the data and research. Also, share with the team the logo designed to appear on the baseball bats.
Investigation
Plan an investigation to gather evidence related to the change in a baseball's motion based upon the sum of the forces on the baseball and the mass of the baseball (5.25 oz.). This investigation should involve a baseball bat of the material you have selected. Use the simulation to gather data using different weights for the bat. Assume the swing speed is the same. Share your findings as part of the multimedia presentation. How would a change in swing speed affect the outcome of the investigation? You may choose to carry out this investigation yourself following the directions you created.


Defined Learning Videos
Runtime: 1:44
Runtime: 1:26
Runtime: 4:55
Runtime: 2:11
Research Resources from Teacher
Suggested Literary Connection:
Casey at the Bat (Visions in Poetry)(Paperback) by Ernest L Thayer.
Casey at the Bat: A Ballad of the Republic Sung in the Year 1888 (Caldecott Honor Book) by Ernest Thayer and Christopher Bing.
Defined Learning Resources
Baseball Bat Sweet Spot
Simulation
Use data analysis skills to find the "sweet spot" of a baseball bat. Big Idea: Students will analyze and interpret the results of a computer simulation by comparing bar graphs from different data sets to determine which type of baseball bat (wood, metal, composite), provides the best overall energy return.
Click HERE for full screen.
Stats to the future: Explaining WAR and why it is still an imperfect stat.
Source: Sporting News. Author: Edwards, J. (2018, February 9).Mathematics And Baseball
Constructed Response
If you play or watch baseball you have heard of batting average. You might even know that .300 is a good batting average. For many years batting average was the most important statistic in baseball for judging the quality of a hitter. This is changing.
Mathematics And Baseball
Constructed Response
If you play or watch baseball you have most likely heard the term batting average. You might even know that .300 is a good batting average. Historically, batting average was the most important statistic in baseball for judging the quality of a hitter. This is changing.
Why are there more .300 hitters than .299 hitters, and why it matters.
Source: Deadspin.com. Author: Moskowitz, T. & Wethein, L. (2011, January 31).What is the new .300? How to read a 21st century baseball card.
Source: ESPN. Author: Miller, S. (2017, April 18).Defining athletes by statistics: the magical.300 batting average.
Source: Significance. Author: Albert, J. (2012, April 24).Comparison between aluminum and composite BBCOR bats
Source: www.batsfinder.com Author: Bats Finder (2019).Data Table
-
Which bat performed best under the specified conditions?
Investigation
-
How do the length and weight of the bat potentially impact the forces exerted on the baseball?
-
How do the materials of each bat play a role in the forces exerted on the baseball?
-
What mathematical calculations will be important to help you design this experiment?
-
How do the length and weight of the bat potentially impact the forces exerted on the baseball?
-
What mathematical calculations will be important to help you design this experiment?
Marketing Design
-
What is special about the community in which the university is located?
-
What is the school mascot?
-
How does a logo tie into the university and community for which it was developed?
Research Paper/Report
-
What did you discover about bat length, weight and location of contact?
-
How do the characteristics of each bat material play a role?
-
What values did you choose for each of these?
Drawing and Abstract
-
What are appropriate lengths and weights for bats at the collegiate level?
-
How does Newton's Third Law apply to this situation?
-
Which type of bat will you recommend to a baseball team?
Multimedia Presentation
-
How durable is each type of bat?
-
What different types of materials are used to make bats?
-
What are the costs of the different types of bats?
Process Video
Design Process
Brainstorm Ideas
It's time to think about product development. You will begin with ideation, which is the start of the creative process. During the ideation phase, you will brainstorm with your group about all the potential ways you could approach this product. Remember, the more creative and innovative your ideas are at this stage, the better! Your group will need to check and make sure that each of your initial ideas are meeting the requirements related to the goal, audience and product description. What are the directions or criteria that need to be followed? Who is your audience and what will they need from this product?
Analyze & Decide
As you discuss the possibilities during your brainstorming, you will narrow the ideas down to those that seem like they would best solve the problem or address the challenge. Once you have narrowed down to two or three ideas, grab some paper and a pencil and make an outline or sketch a plan for each one. What will the product need to include? How will you best use the information that you found in your research to create it? What would the product look like based upon each idea?
After outlining your product ideas. Discuss with your group and decide on ONE that you would like to move forward with. When you have selected one idea, you will move on to the creation phase, keeping in mind that you may go through several rounds of creation and revision before you are ready to present.
Create & Revise
It is possible that while you are creating the first version of your product, you will develop more questions that need to be answered before you can continue. If so, you may need to do additional research. Reflect on how any new information affects your product and make revisions as needed.
Your group should also be looking at the rubric during the creation phase. Here, you can practice thinking critically and collaborating with your peers to understand what needs to be included in your product. Then, you should reflect on whether or not your initial work meets those criteria. If you realize that it does not, you may need to go back and make additional revisions.
As you work through the process of creating and revising your product, communication with your teacher and classmates will be very valuable. Asking for help and discussing your product with others can help you clarify whether or not your product meets the goal of the task and is appropriate for the audience.
Remember, creating this product is a fun opportunity to apply what you have learned about important topics in a more creative and independent way.
Brainstorming: Based on your group's analysis of the research, brainstorm potential solutions, designs, and recommendations
Enter your brainstorming ideas below.
Analyze/Decide: Based on your group's brainstorming - decide on the best ways to move forward and create a product that meets the needs of the target audience and addresses the goal of the task.
Write below what you or your team have decided to create.
Marketing Design
Your consulting firm has a contract to design a logo to be placed on the bats that the university selected. The design/logo should have strong connection to the team for which it is developed. Eastern Pennsylvania's mascot is the Golden Eagle, however with your teacher's permission you may ask to design a logo for a university of your choice. Keep in mind that you must also explain the reasons for your design and how it ties into the university/community for whom it was developed.
Drawing and Abstract
Your task is to either draw or develop a computer replica of your chosen bat. This drawing/draft should be done to scale and should include length and weight information. Be sure to create a key that includes your scale measurement. With this drawing now create a visualization that demonstrates the motions of the two colliding objects (baseball and bat). With your drawing complete, provide an abstract explaining how Newton's Third Law applies to this situation. Also, briefly explain how the different materials used to make the baseball bats affect the collision with the baseball.
Data Table
Your task is to create a data table that compares wood, metal, and composite bats. You will not have time to test all of the different combinations of length, weight, and sweet-spot location, so your first step will be to figure out which values you will want to plug into the simulation in order to come up with meaningful data for selecting a bat.
Step two in this task is to test the bats and record your data.
Next you will use your data to create a data table, graph, chart, or other visual representation of your results.
Finally, provide a recommendation for the type of bat that the team should purchase based on an analysis of your data.
Be prepared to explain to your teacher why you chose the lengths, weights, and sweet-spot locations that you did. The data table should also include information about how many trials of each variable you did and why you think this number gives you reliable data.
Research Paper/Report
Create a report to be submitted to the University of Eastern Pennsylvania that describes the research process that you used to test the different baseball bats. Include information about the types of bat and the characteristics of each material. This report should state the reasons you had for using some lengths, weights, and sweet-spot locations but not others (i.e. you did not test between 24 and 28 inches because nobody on a college team uses a bat that short). It should also include information about how many trials of each variable you did and why you think this number gives you reliable data.
Multimedia Presentation
This will form the basis of your presentation to the coach and captains of the team. This presentation should support your discussion and may have the other products embedded within. Be sure this presentation references the research you conducted related to the types of materials used to make bats. This should also include the durability and cost of each type of bat. Share with the audience the test you performed and the variables that were considered (simulation). How did the data gathered inform your decision? At the end of your presentation, provide your conclusions based upon the data and research. Also, share with the team the logo designed to appear on the baseball bats.
Investigation
Plan an investigation to gather evidence related to the change in a baseball's motion based upon the sum of the forces on the baseball and the mass of the baseball (5.25 oz.). This investigation should involve a baseball bat of the material you have selected. Use the simulation to gather data using different weights for the bat. Assume the swing speed is the same. Share your findings as part of the multimedia presentation. How would a change in swing speed affect the outcome of the investigation? You may choose to carry out this investigation yourself following the directions you created.
This is the end of the project. Be sure all check-ins and products are completed!
To return, press the button below
Related Content
Performance Tasks
Manufacturing Engineer: Sunglasses
Grade: 8Your design team has one goal, and that is to improve the quality, utility, visibility, comfort and aesthetic of sunglasses that are currently on the market. After collecting research, you will have to take some time to complete the ideation process. You should create a minimum of five sketches of your first thoughts related to your design improvements. Next, you should prioritize your designs, selecting one for the creation of advanced sketches of two views. These sketches should be complete with dimensions, lens tint, colors and material selections. You will need to explain how these lens decisions and the materials used to create the lenses will protects the eyes from the harmful rays of the sun. Many extreme sport enthusiasts are looking forward to the unveiling of the new selection that will be on the market! The company is interested in the scope of your research and the decisions that your team made that will ensure competitiveness on the market.
Literacy Tasks

Baseball Bat Material
Should metal and composite bats be allowed in baseball competition involving players between the ages of 13-15?
After reading articles and informational texts, write a proposal to the interscholastic athletic association that addresses the question and supports your position with evidence from the text(s). Be sure to acknowledge competing views and evaluate the importance of performance and safety.

Batting Averages
Constructed Responses
Mathematics And Baseball
If you play or watch baseball you have heard of batting average. You might even know that .300 is a good batting average. For many years batting average was the most important statistic in baseball for judging the quality of a hitter. This is changing.
Flesch Kincaid Grade: 3.8
| Common Core Band | ATOS | Degrees of Reading Power® | Flesch-Kincaid | The Lexile Framerwork® | Reading Maturity | SourceRater |
|---|---|---|---|---|---|---|
| 2nd - 3rd | 2.75 - 5.14 | 42 - 54 | 1.98 - 5.34 | 420 - 820 | 3.53 - 6.13 | 0.05 - 2.48 |
Mathematics And Baseball
If you play or watch baseball you have most likely heard the term batting average. You might even know that .300 is a good batting average. Historically, batting average was the most important statistic in baseball for judging the quality of a hitter. This is changing.
Flesch Kincaid Grade: 5.6
| Common Core Band | ATOS | Degrees of Reading Power® | Flesch-Kincaid | The Lexile Framerwork® | Reading Maturity | SourceRater |
|---|---|---|---|---|---|---|
| 4th - 5th | 4.97 - 7.03 | 52 - 60 | 4.51 - 7.73 | 740 - 1010 | 5.42 - 7.92 | 0.84 - 5.75 |
Teacher Case Studies